So you want to download “Big Data.” You could be a social scientist wanting to take your first stab at downloading and analyzing 100 organizations’ worth of tweets. Or a marketing or public relations practitioner interested in analyzing Facebook or Instagram or Pinterest YouTube activity by your competitors. Or a budding data scientist interested in getting your toes wet and doing your first Big Data download.
This post is the first in a series designed to help you understand at a conceptual level the main moving parts you’ll have to grasp in order to successfully get the data you need. This one deals with levels of analysis in Big Data. It is critical to have a basic understanding of this concept if you are to understand how to correctly get the data you need.
What is a Level of Analysis?
In the abstract, the term level of analysis refers to the scale of your research project. More concretely, it refers to the level at which your analyses are conducted. For instance, a political scientist would generally conduct research at one of three levels of analysis: the individual, the state, or the system. A communication scholar, in turn, might study, among others, the individual, the message, or the conversation. And a finance scholar might study the trader, the firm, the transaction, the security, the stock exchange, or the country.
‘Big Data’ can derive from many sources, but for the purposes of this post I’m assuming you’re interested in capturing some form of social media data — such as Tumblr, Twitter, Facebook, Pinterest, or Instagram. What is important to realize is that on all social media sites there are three fundamental levels of analysis — the account, the message, and the connections — and that these correspond to the three basic building blocks of social media engagement. Importantly, the social media sites generally allow you (with limits) to access their data, and the data are organized according to the level of analysis.
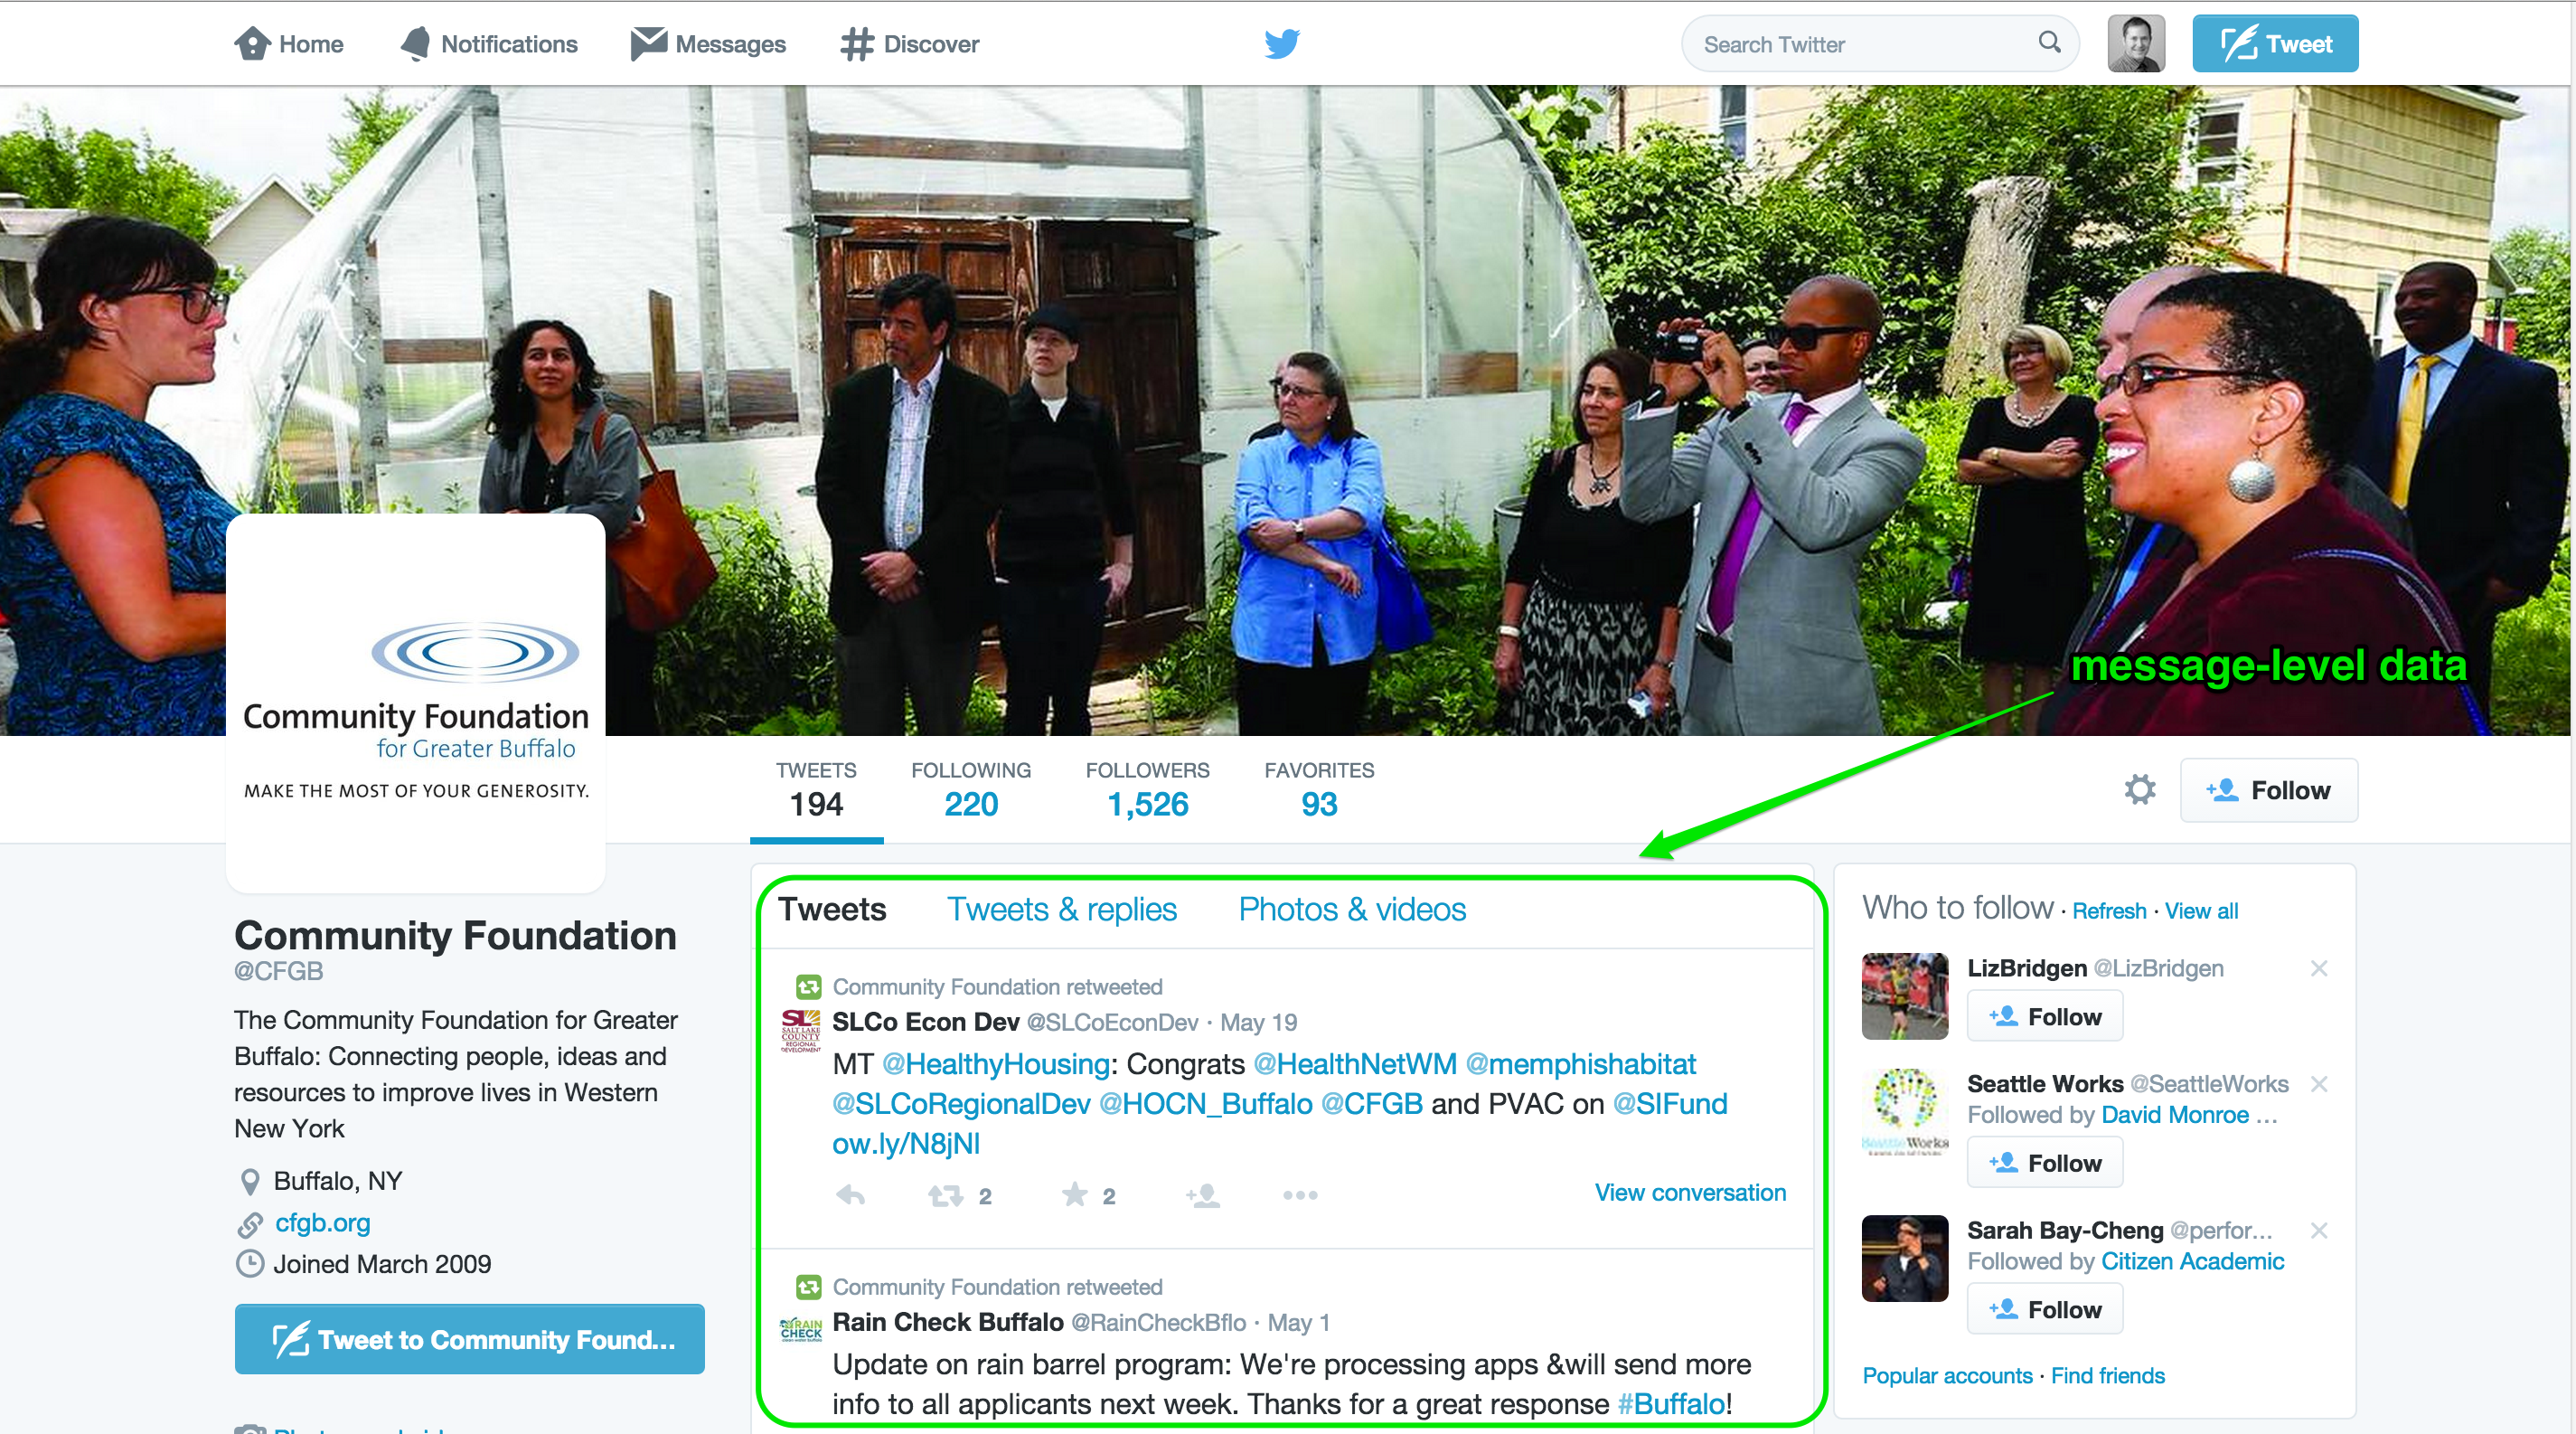
To demonstrate these ideas I will use the example of the Community Foundation for Greater Buffalo’s Twitter page.
Level One: The Account Level
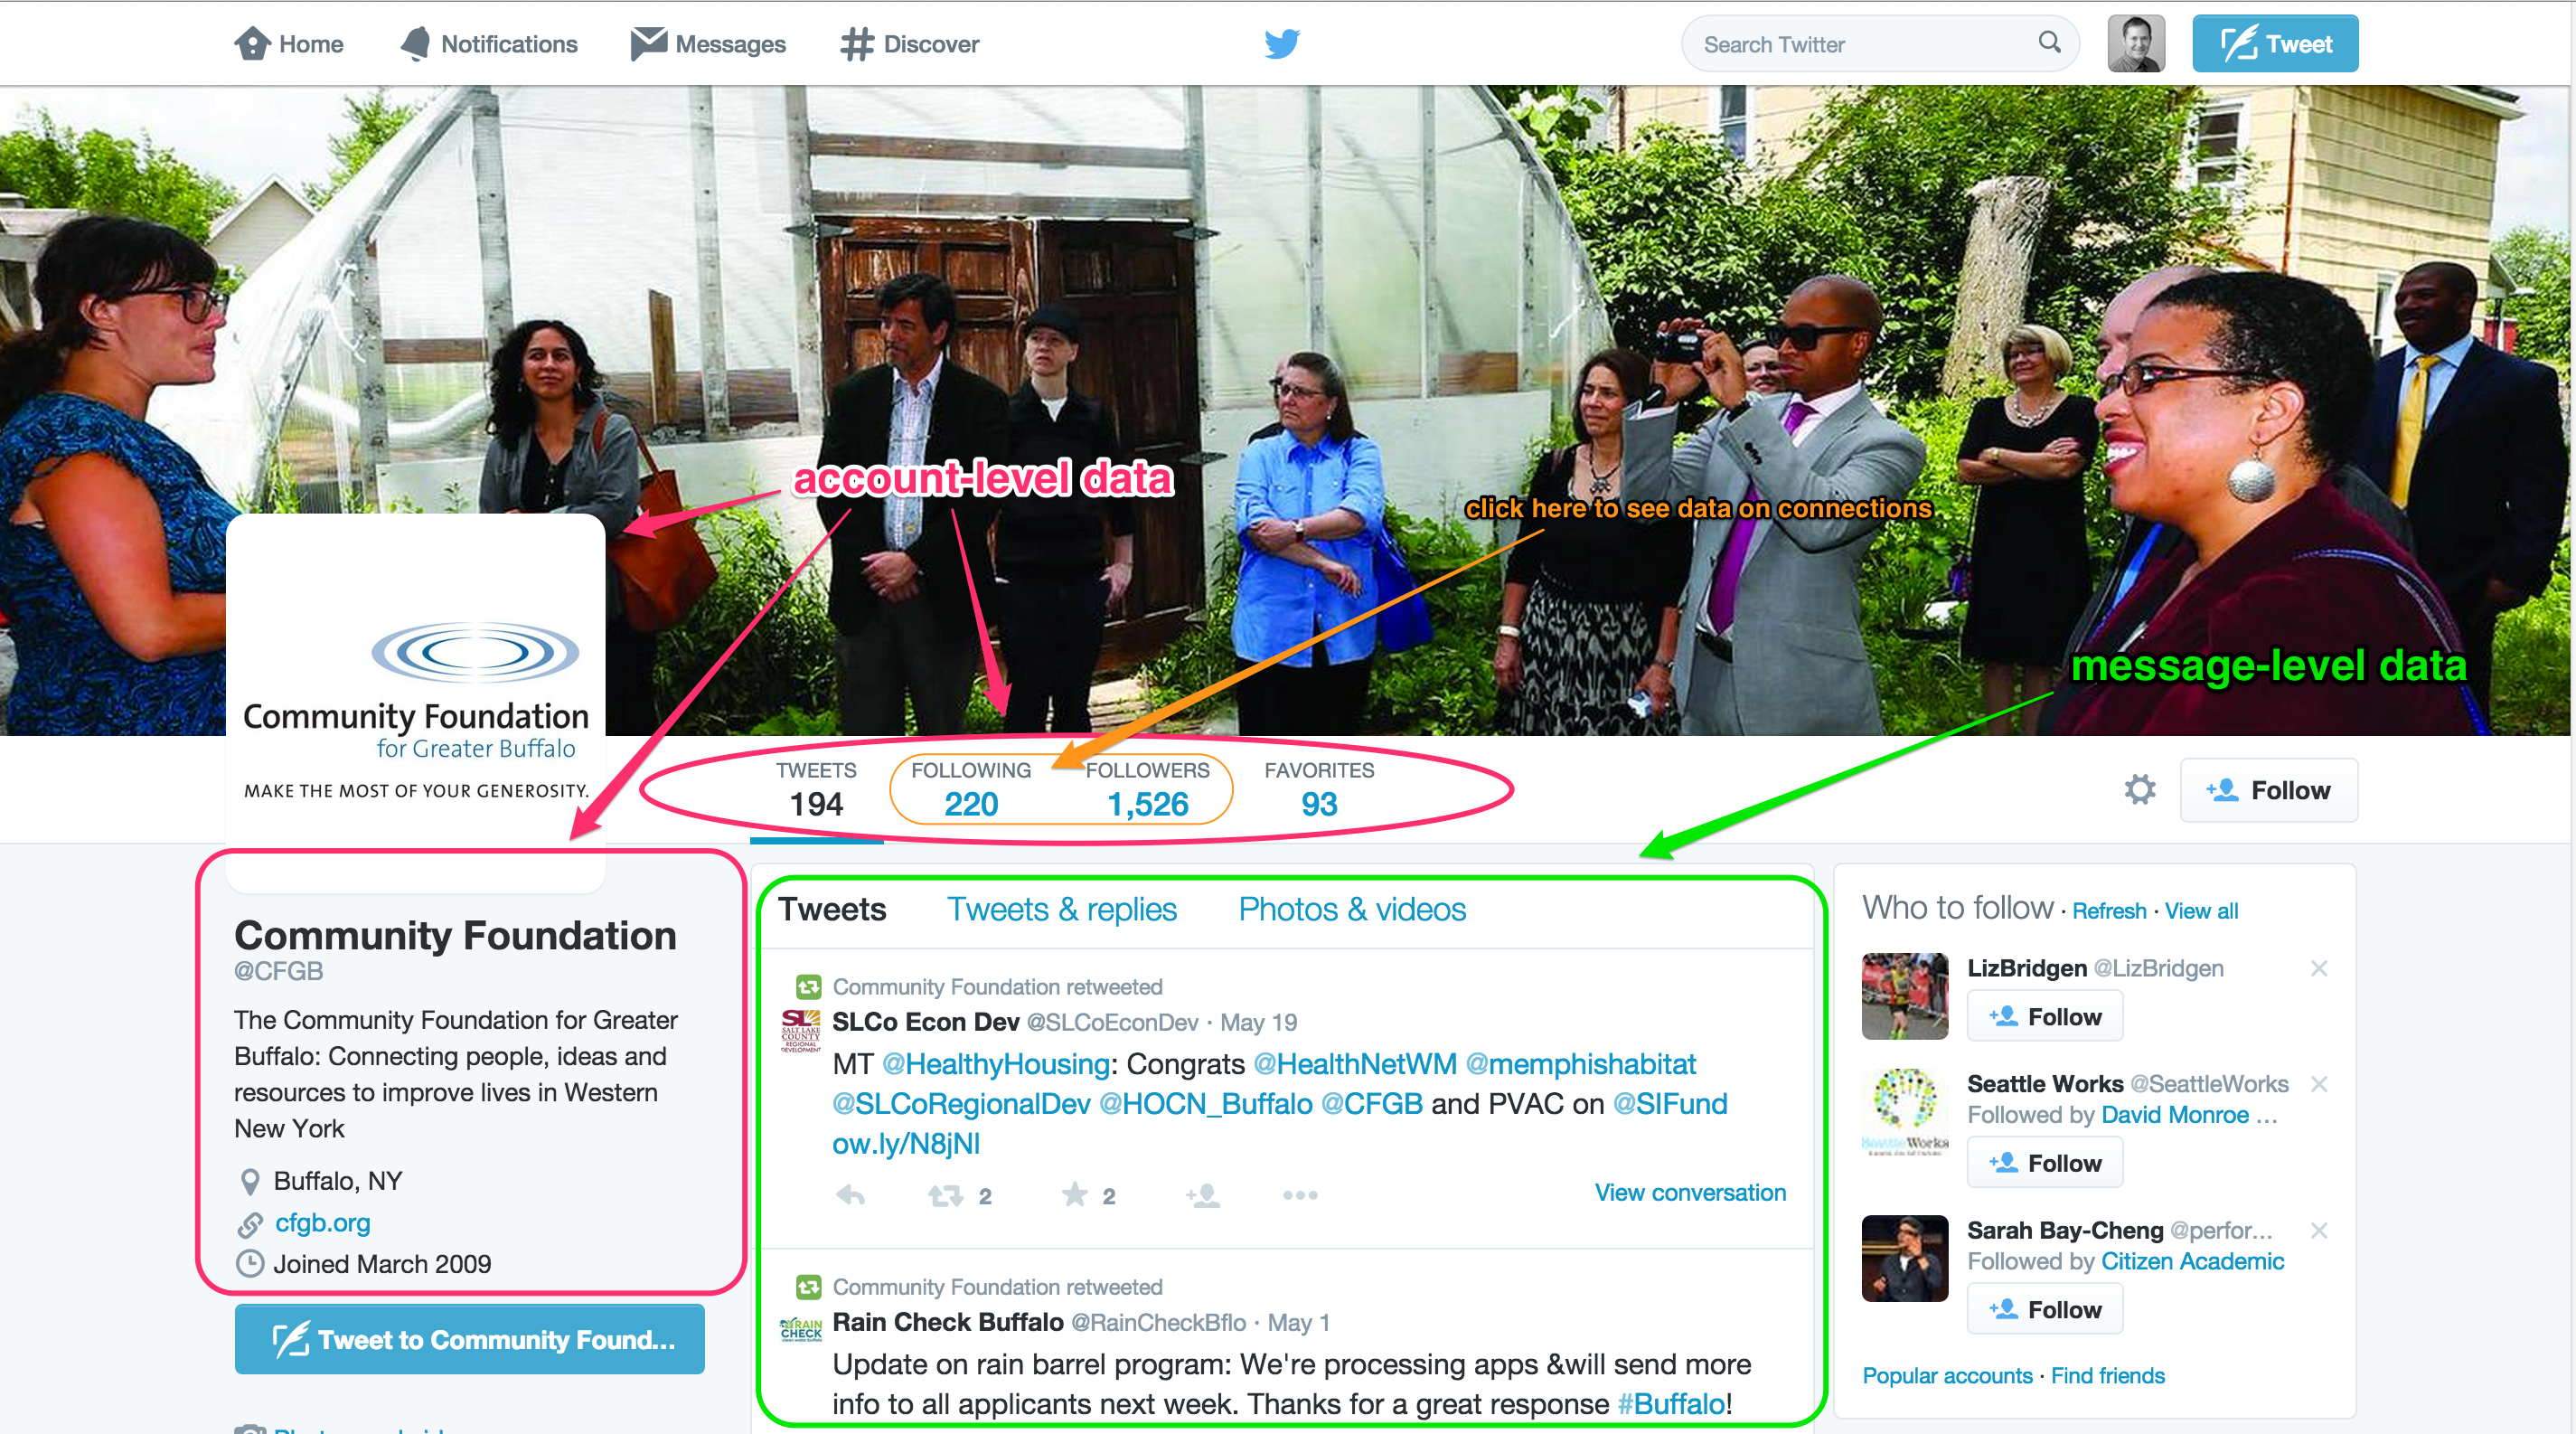
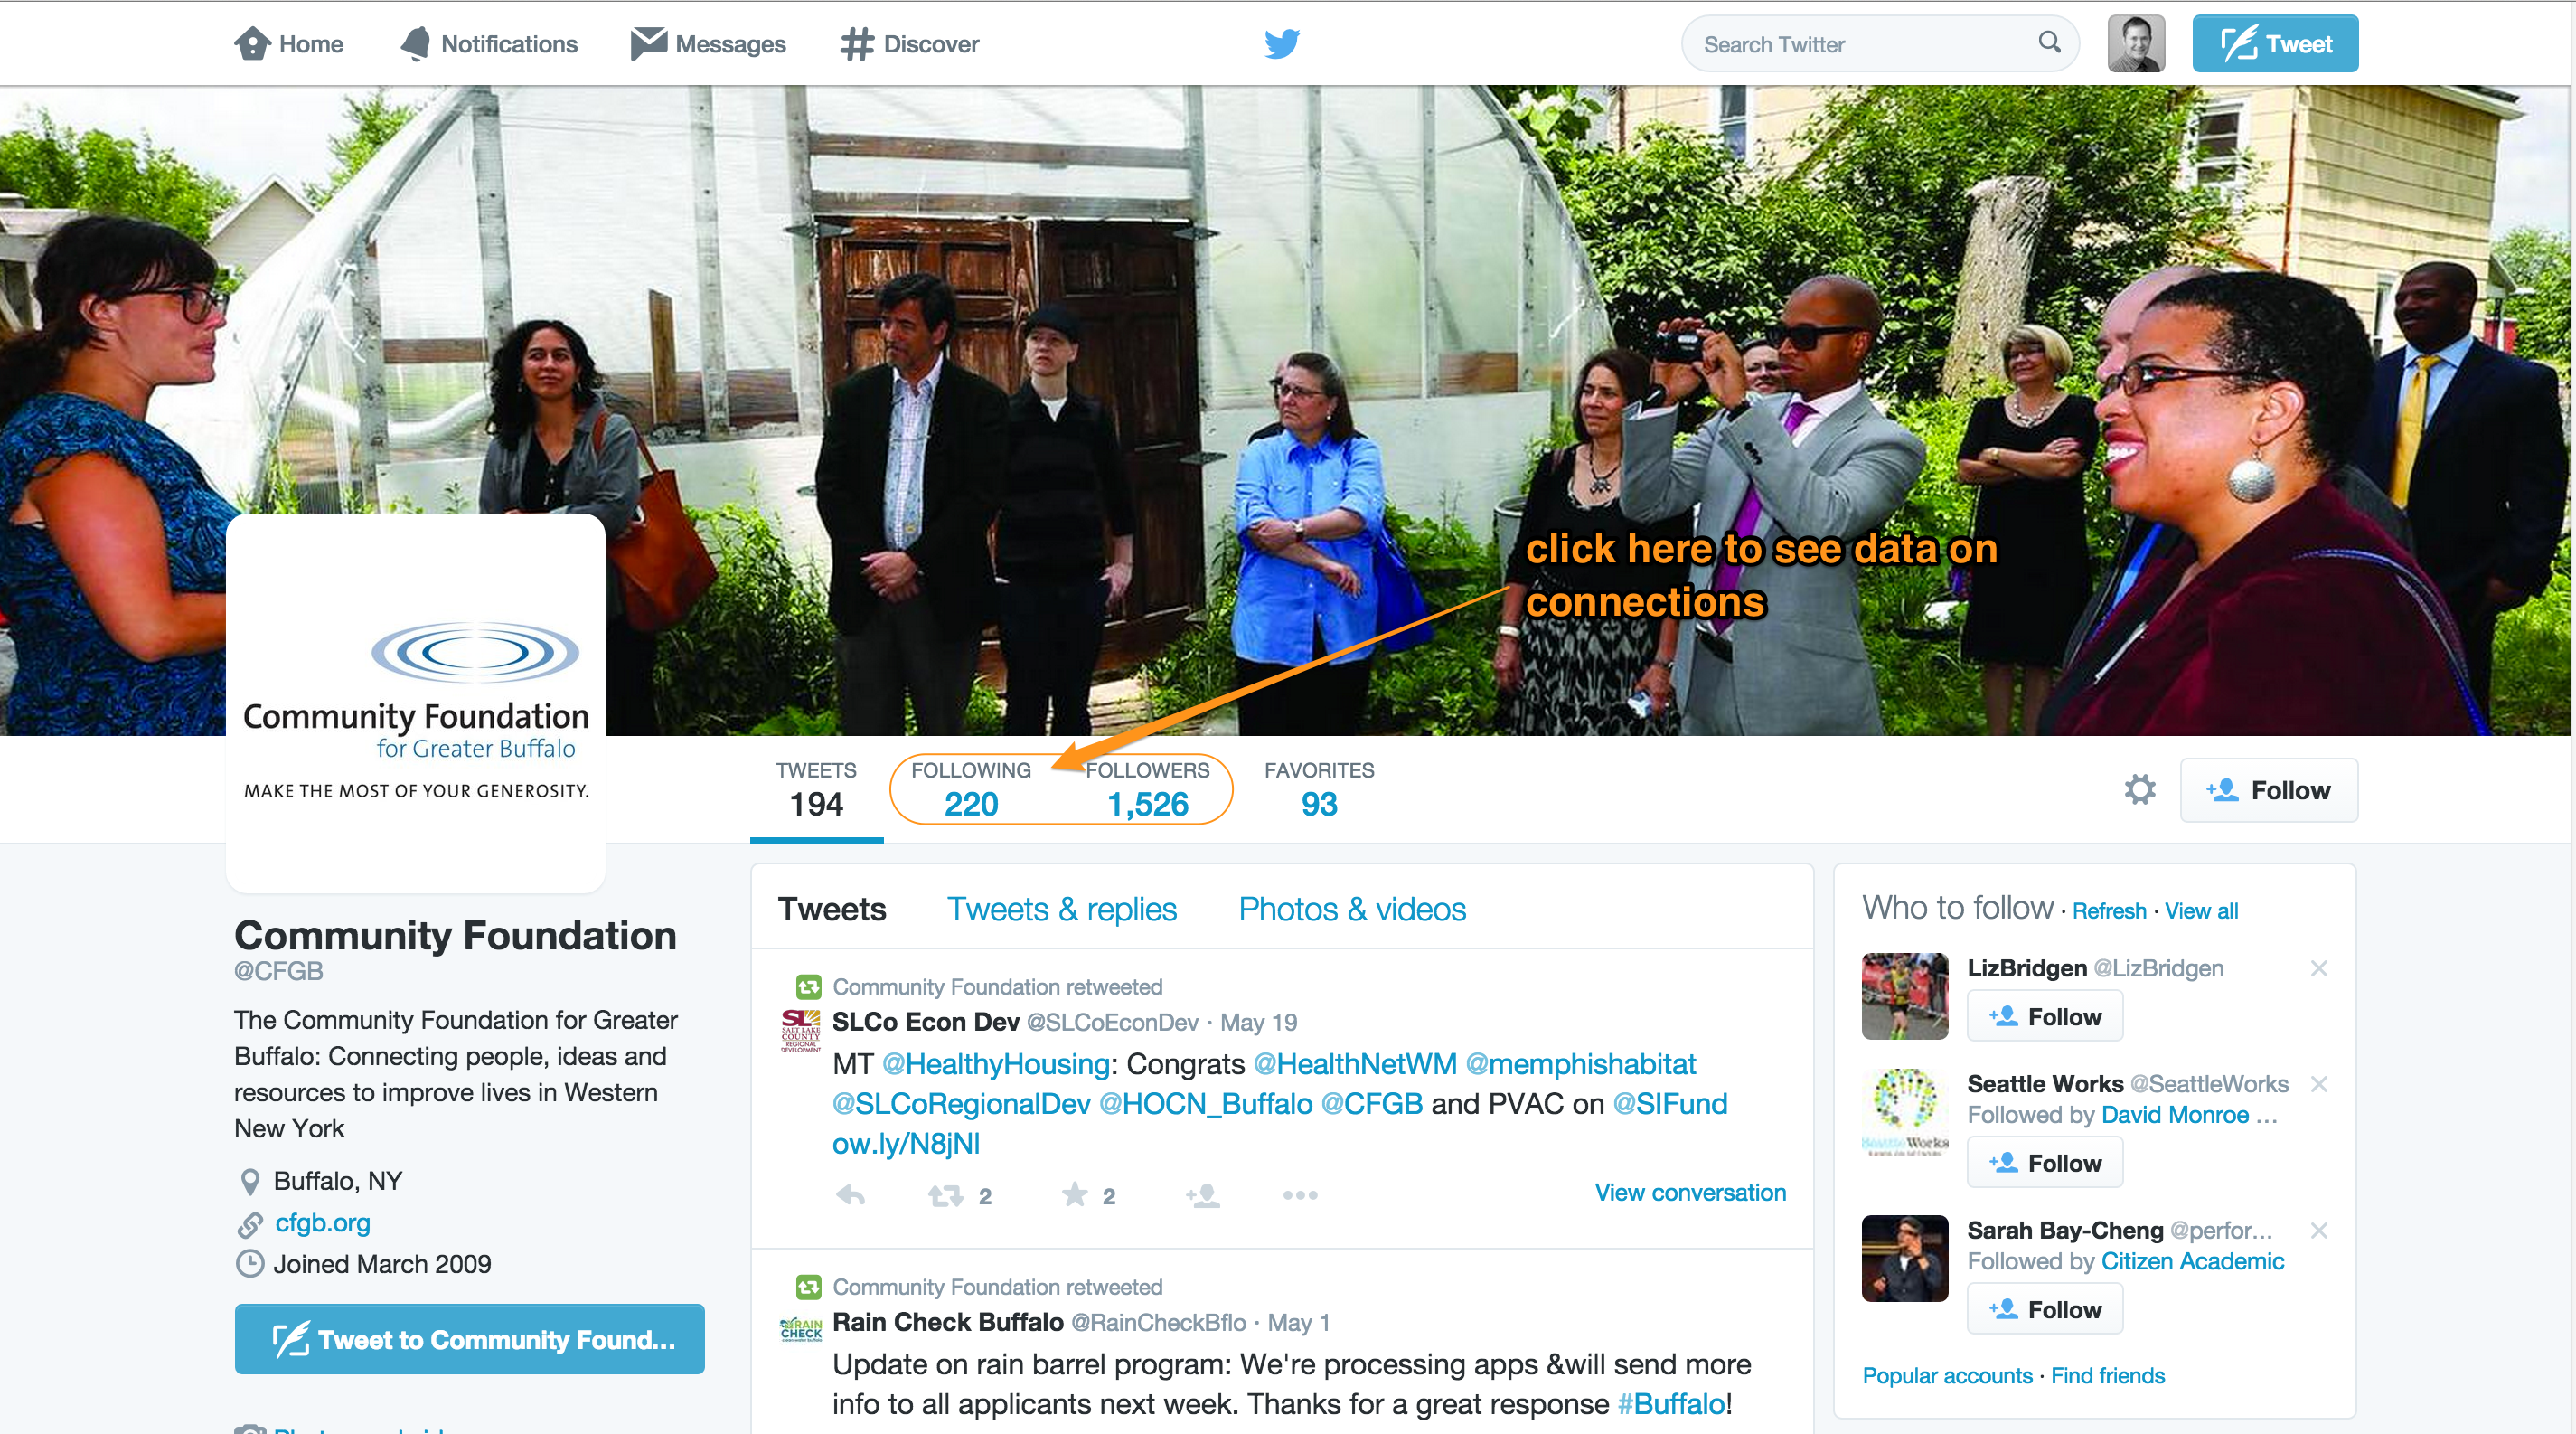
The first level is the account level. Take a look at the screenshot below. As I’ve indicated on the image, there are a variety of account-level data — the images the organization has uploaded, its description, its location, its website address, and the date it joined Twitter. You can also see how many tweets it has sent to date (194), how many other Twitter users it follows (220), how many other users are following the organization (1,526), and how many tweets the organization has ‘favorited’ or archived (93). All of these data are at the account level of analysis. They are, effectively, characteristics of the organization’s account at a snapshot in time.
If we are being strict with social scientific language, we would say that the account is the unit of observation for our data here. But we can save the distinction between unit of observation and unit/level of analysis for a future post. For now, the key takeaway is to understand that these account-level data are at a higher level than the tweet, or friendship, or conversation level. They are characteristics of the organization — or more specifically, the organization’s Twitter account.
In line with what I’ve noted earlier, you can access all of the above account-level data through a specific portion of the Twitter application programming interface (API). Specifically, the users/lookup part of the Twitter API allows for the bulk downloading of Twitter user information. You can see a description of this part of the API here, along with definitions for the variables returned. For an overview of how to gather such data, take a look at this tutorial I’ve written.
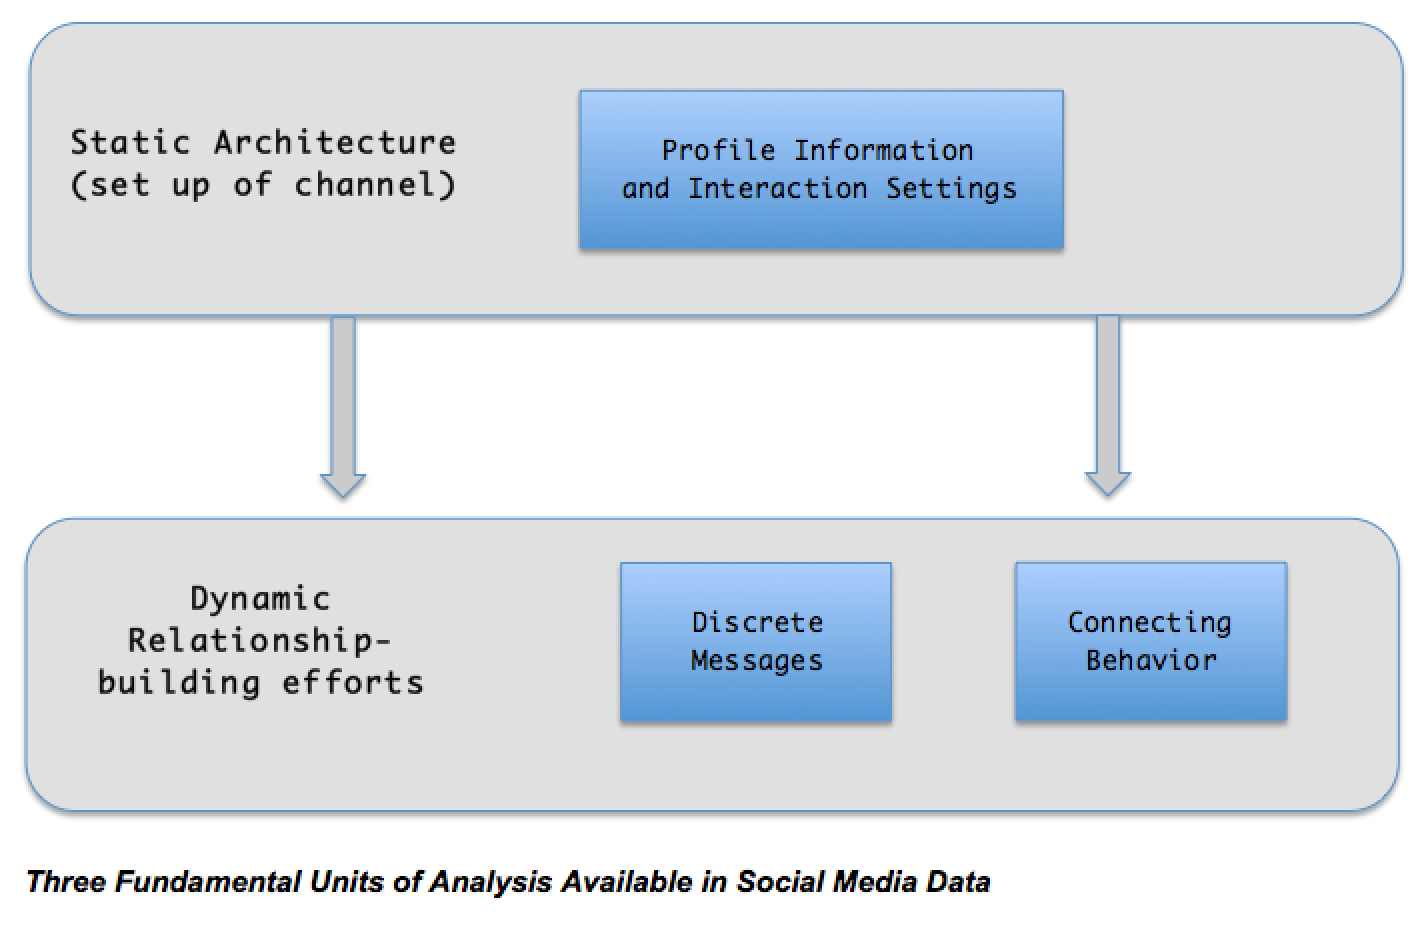
There are good reasons why you would want to gather these data. For instance, you might want to track how many followers an organization has over time. In all of my studies using Twitter data I always start the data-gathering process by downloading these account-level data. But you should note that the account-level data are typically the least interesting. It is at this level that we see what I refer to as the static architecture of an organization’s engagement efforts on social media (see the first figure in this post). Think of this as the venue in which customer or stakeholder engagement can take place. On Twitter, the ability to modify the architecture is limited: the organization can add pictures, write a compelling description, and include a link to other social media accounts, but it cannot change the nature of any interactions that take place — those are hard-coded into the Twitter platform. Other social media sites allow for more customizable architecture. For instance, Facebook allows page administrators to change options for fan commenting while allowing greater customizability in the static architecture via apps.
Level Two: The Messages
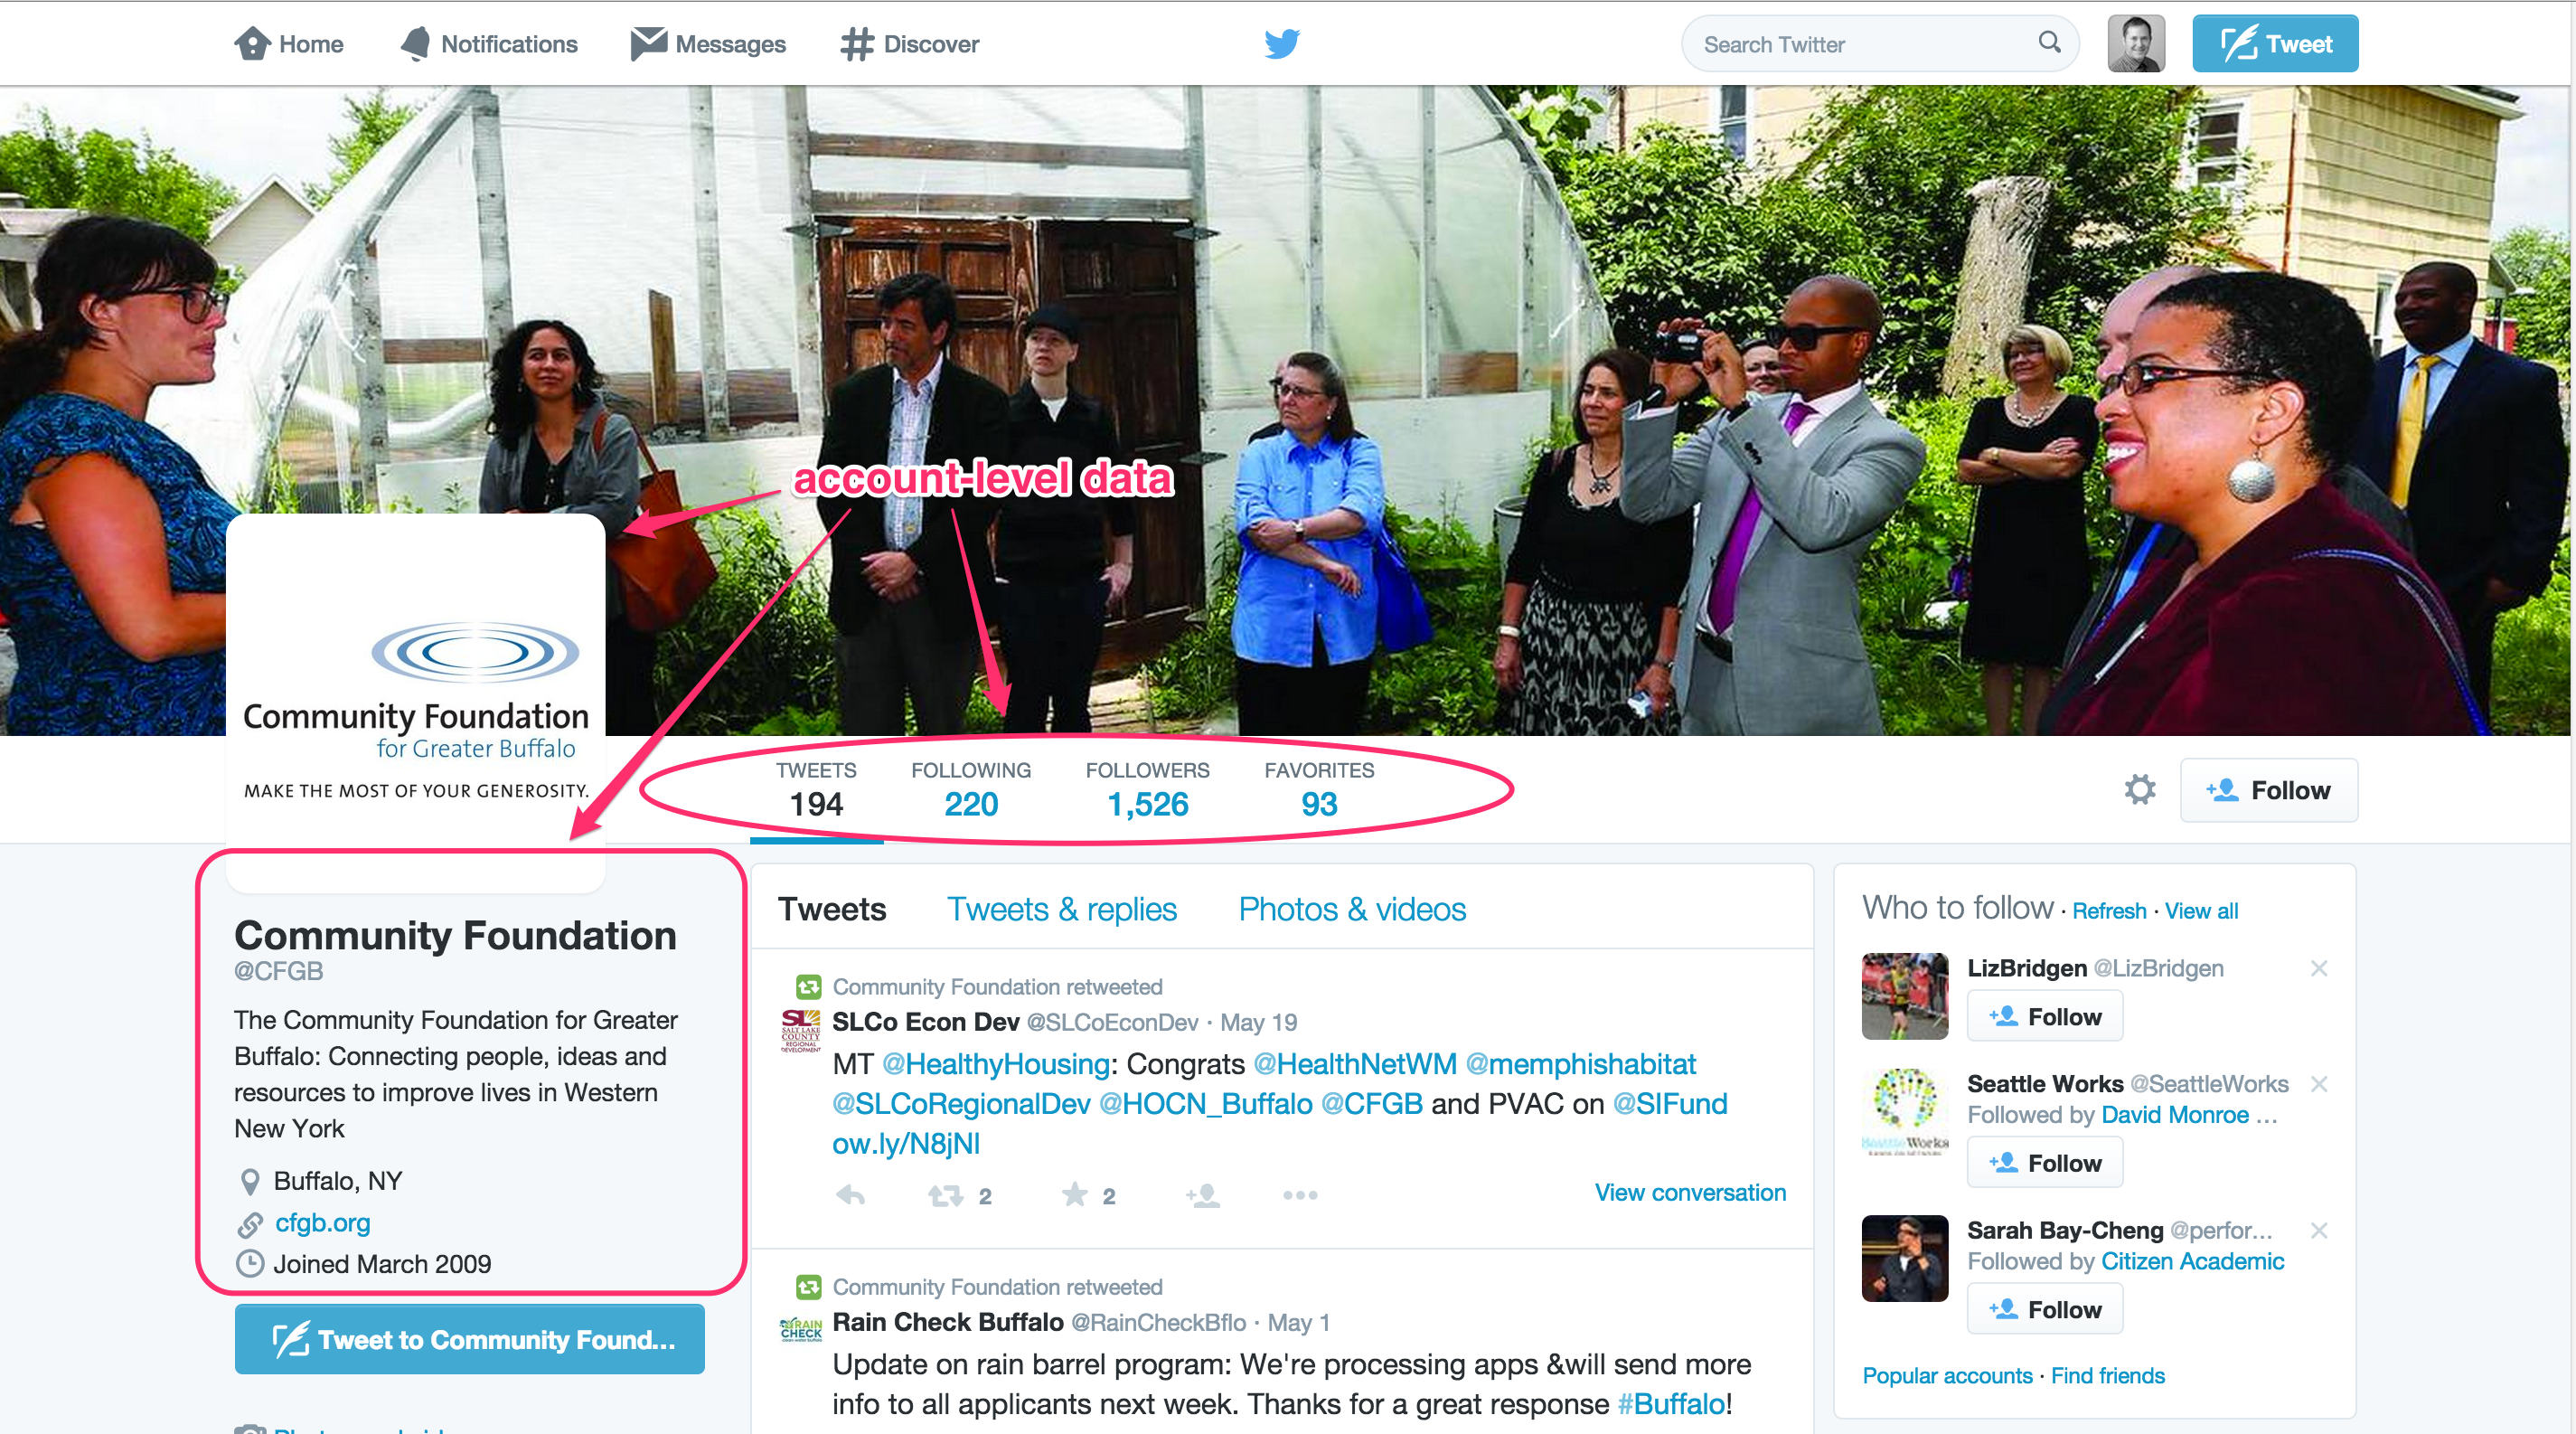
The second is the message level. Here is where we really get to the heart of the social media data. No matter the social media platform, the heart of an organization’s engagement efforts occurs not through static architectural elements but through dynamic engagement efforts — through the day-to-day messages the organization sends and the daily connecting actions it takes. The messages are the heart of any social media platform, though they go by different names according to the platform. On Twitter, they are tweets. On Facebook, it’s statuses. On YouTube, videos. On Pinterest, it’s pins. On Instagram, it’s photos. Despite the different names, the point is that at their core all social media platforms stress dynamic communication, as manifested in the discrete visual or textual messages an organization sends to its followers.
Take a look at the above screenshot. You’ll see I’ve indicated the message-level data. These are the tweets. Through accessing Twitter’s user_timeline API, you can access all of the information seen in the screenshot — the full text of the tweet, whether it was a retweet, how many times the tweet has been retweeted and favorited, links to included photos, etc. In almost any Twitter study you will want to gather these data. And fortunately, you can generally acquire the last 3,200 tweets sent by a Twitter user. If you have 100 organizations in your sample, this means you could easily — in a single day — build a database with 320,000 tweets.
Level Three: The Connections
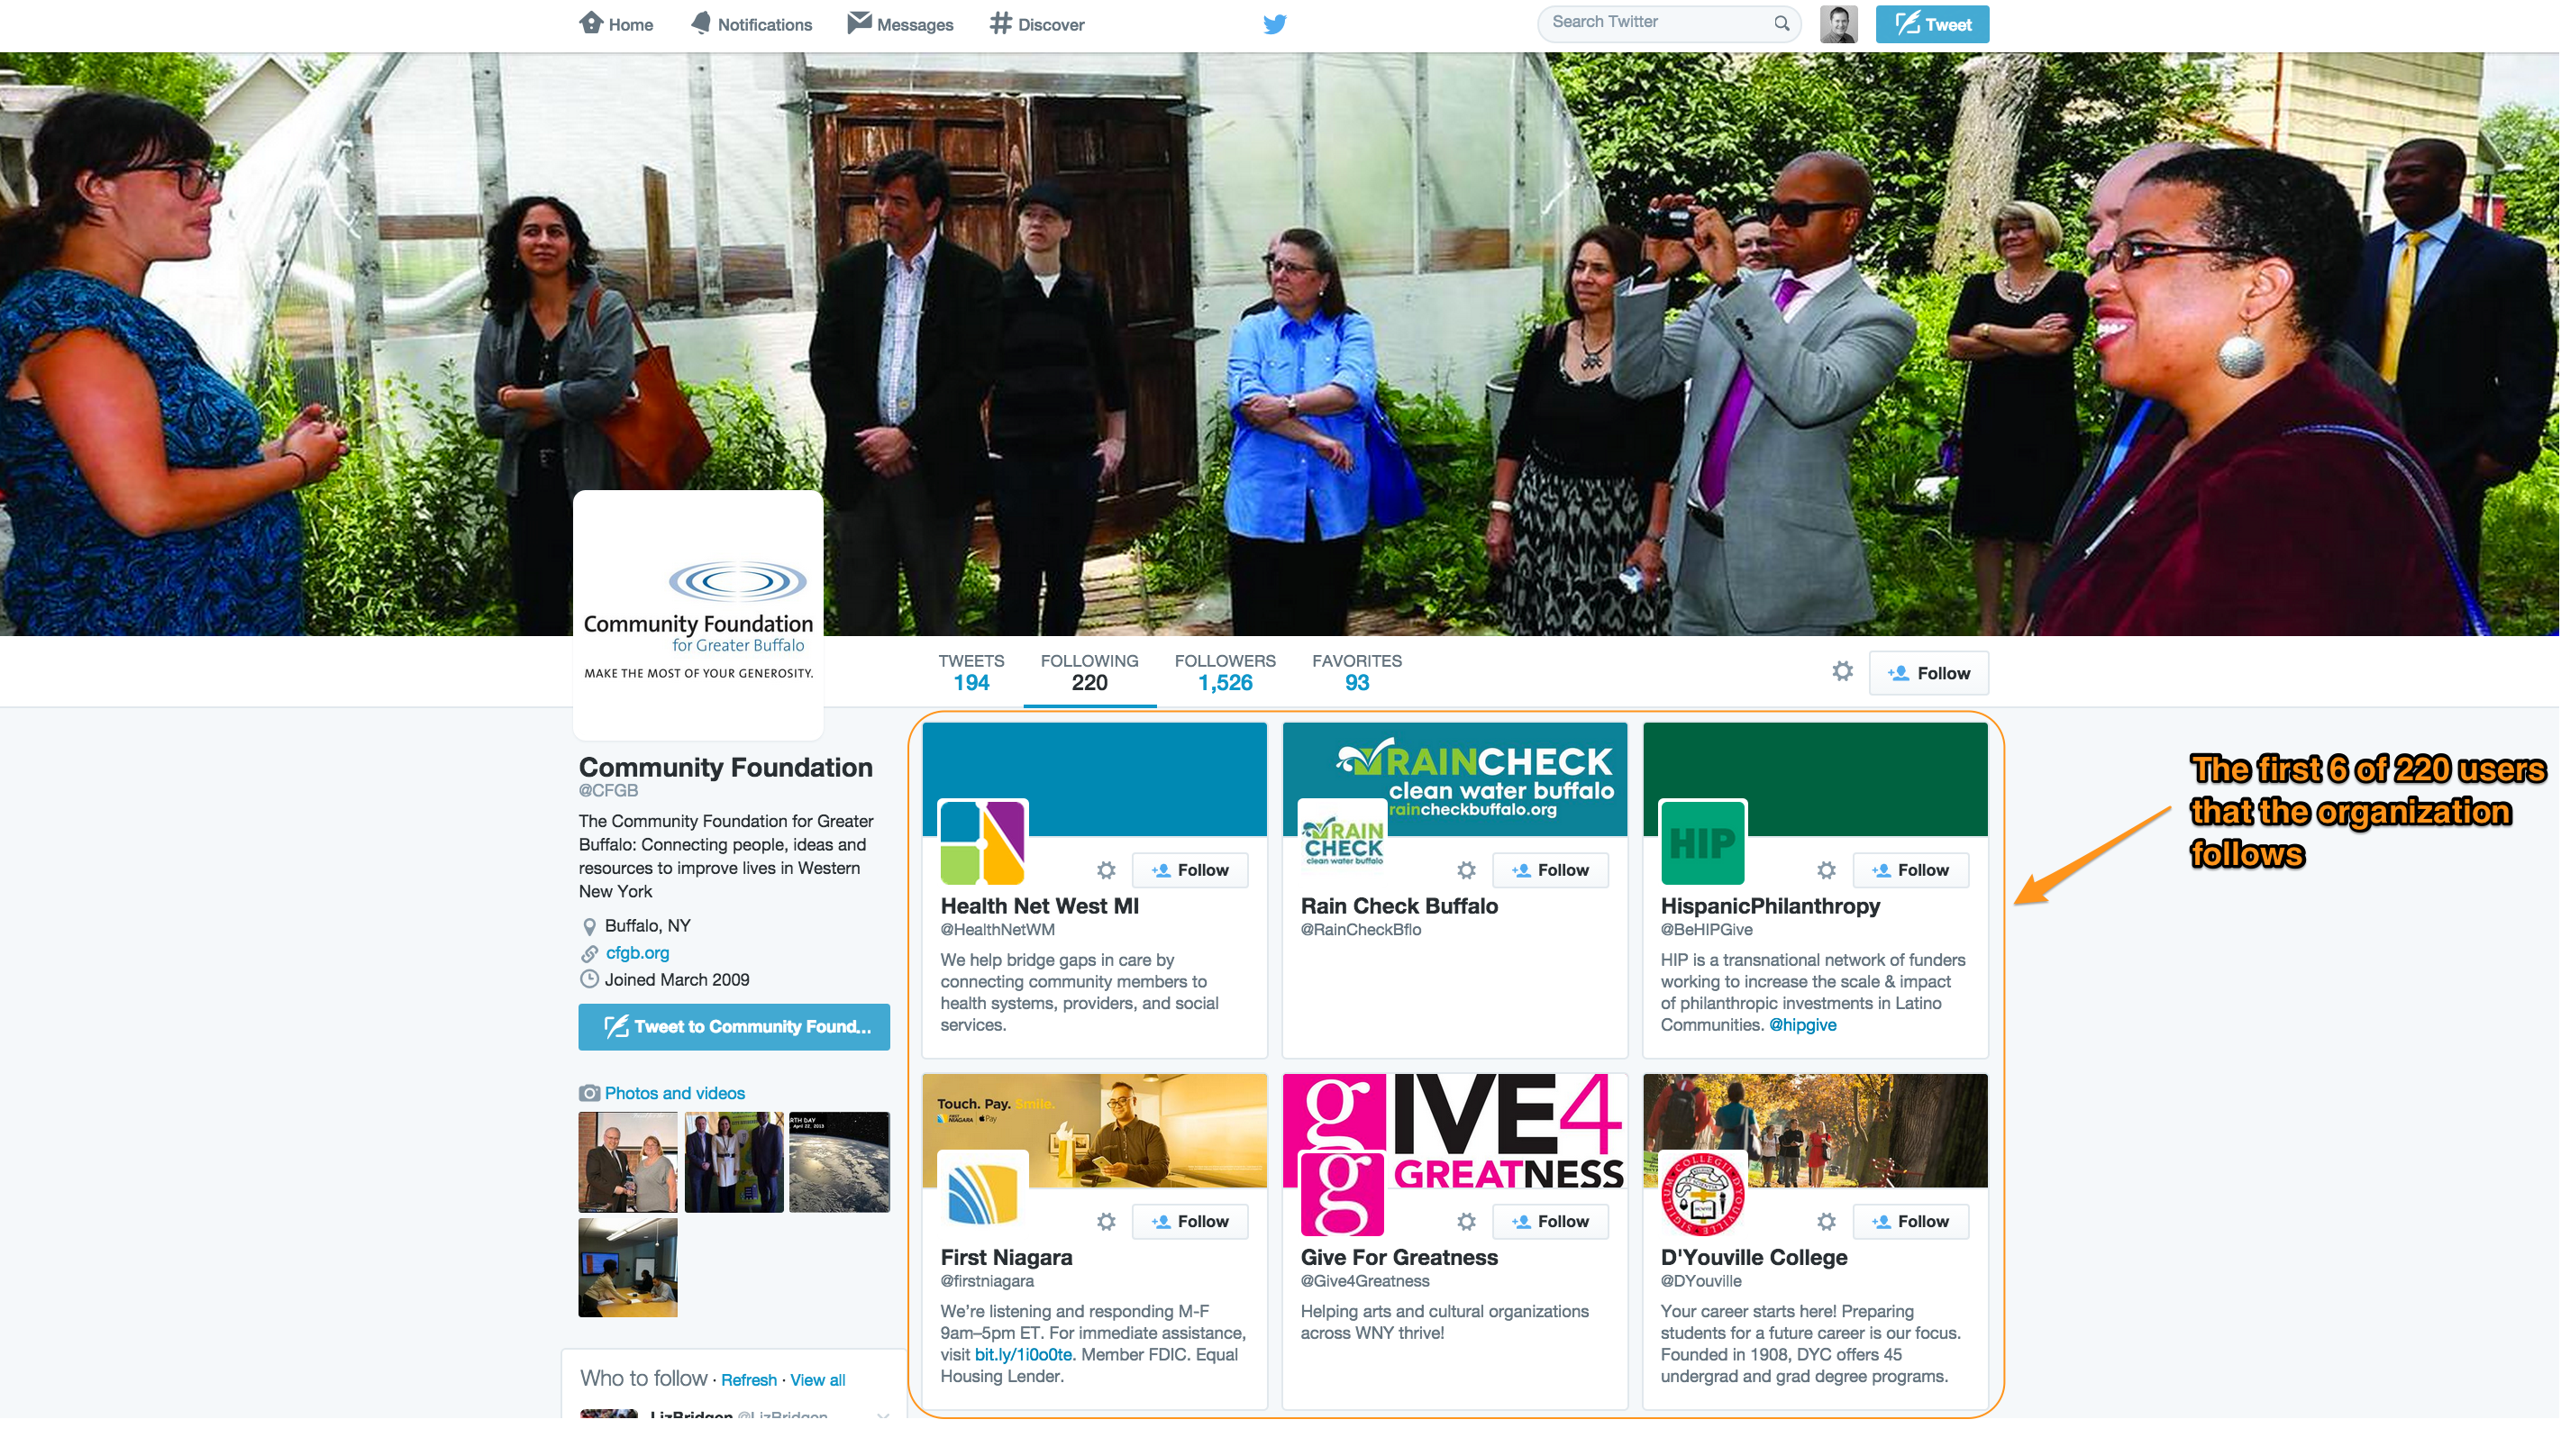
Finally, there is the connections level. You can’t see these immediately on the Community Foundation’s Twitter page, but by clicking on ‘Following’ or ‘Followers’ you can get details on the other users the organization is following or followed by, respectively.
For instance, clicking on ‘Following’ you will get what is shown in the screenshot below. Here you’ll see the first six Twitter users that the Community Foundation for Greater Buffalo follows. After the messages (tweets), this is the second most-important set of data — once again, here we can see the results of the organization’s dynamic engagement efforts — the formal social network connections it is making with other Twitter users.
As with the account-level and message-level data, these data are also available for download. To get a list of users the organization follows, access Twitter’s GET friends/ids API, while to get a list of users that follow the organization, access the GET followers/ids API. This is where you would go to get the data for a social network analysis of a sample of organizations’ friend and follower networks. Future tutorials will cover how to do this.
Summary
Here are the two key takeaways. One, I hope you now understand that all social media sites have three fundamental elements that individuals or organizations can employ to engage with their audience: 1) static architecture, 2) discrete messages, and 3) discrete connecting actions. The first is interesting and necessary but not terribly important for most research projects. The latter two reflect an organization’s attempts at dynamic engagement with its audience. These two levels are also the building blocks for aggregating to higher levels of analysis — notably, using tweet-level data to conduct conversation-level analyses or using connection-level data to conduct network-level analyses. I’ll cover those in future posts.
Two, Twitter — as with other social media sites — organizes and grants access to its data through series of APIs that roughly conform to the levels of analysis covered above. What I hope to have conveyed here is that to get the data you need, you first have to understand this essential differentiation of the data. Understanding the different levels of analysis is the first step to understanding the nature of social media data.

